One dashboard. Every facility. Right now.
Your overtime, staffing ratios, and labor costs update as schedules change and staff clock in — not three days later in a spreadsheet someone emailed you.
That three-day spreadsheet project? It's already stale.
Your data isn't the problem. It's that your data lives in five systems that don't talk to each other. Every handoff introduces lag, errors, and blind spots. By the time you assemble the spreadsheet, the answer has already moved.
Problems discovered after payroll instead of prevented
Real-time labor and staffing visibility
Leaders rely on corporate for basic reporting
Role-appropriate dashboards — executives, managers, and schedulers each see what they need
No real-time visibility across communities
Multi-facility dashboard with live data from scheduling + T&A
reduction in wage PPD
reduction in overtime costs
visibility across every facility
No setup. Your data is already there.
Data flows in automatically
Scheduling, time tracking, and payroll feed dashboards in real time. No exports or assembly required.
See what matters to you
Executives see the portfolio. Facility leaders see their building. Schedulers see their shifts. Role-based views by default.
Spot problems early
Overtime trends, coverage gaps, and budget variances surface before they compound into payroll surprises.
Act on the data
Click into any metric to see the detail. Adjust schedules, shift coverage, or staffing plans right from the report.
The numbers your operation runs on
Not a separate analytics tool. Reporting is the visibility layer on top of scheduling and time tracking — live data from the same system your team uses every day.
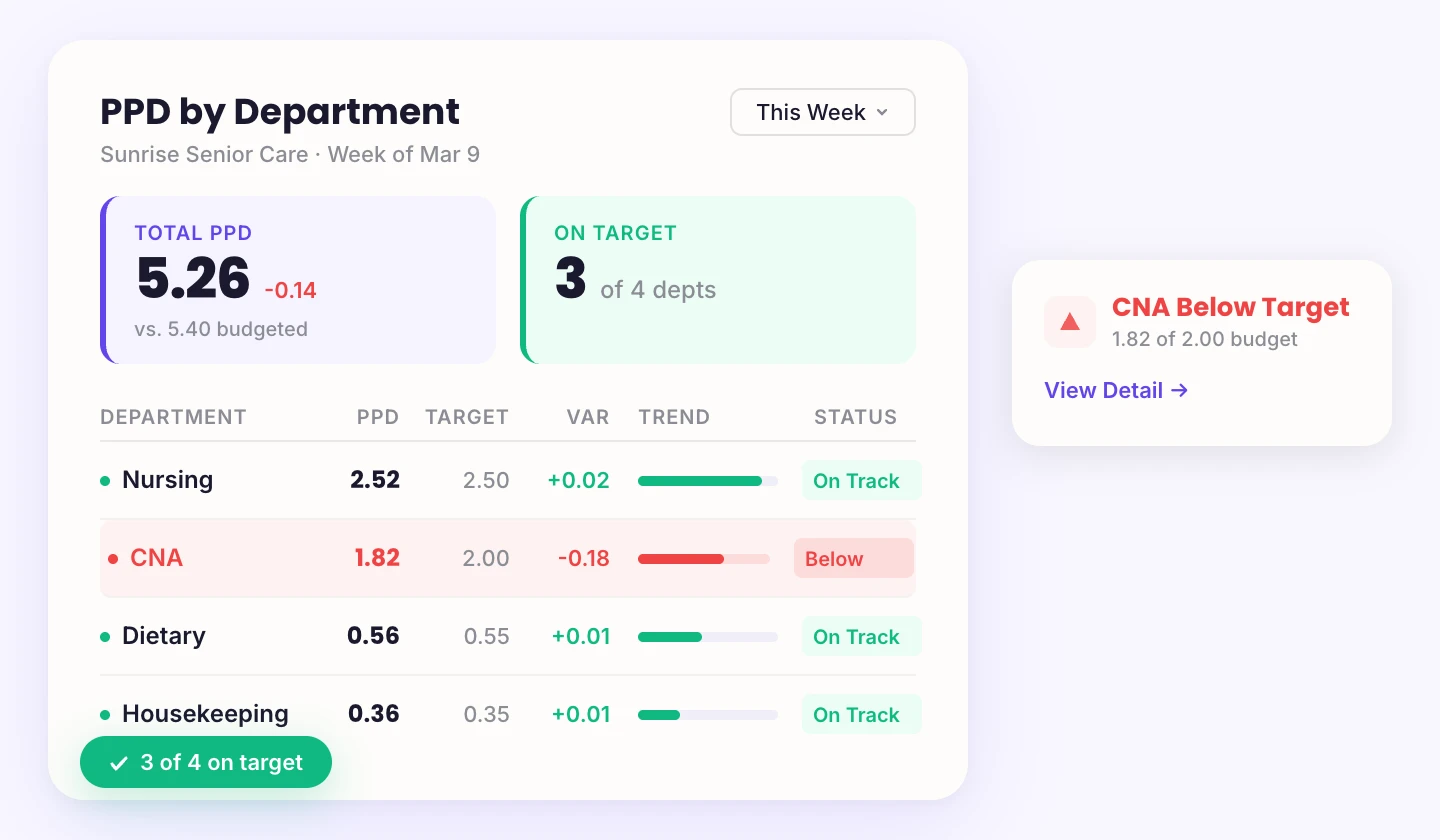
The metric your star rating depends on
Budgeted vs. scheduled vs. actual hours per patient day — by department and care level. See exactly where staffing meets the plan and where it falls short. Click into any day for individual detail.
Directly tied to CMS quality ratings. PPD reporting that lives where you work, not in a spreadsheet.
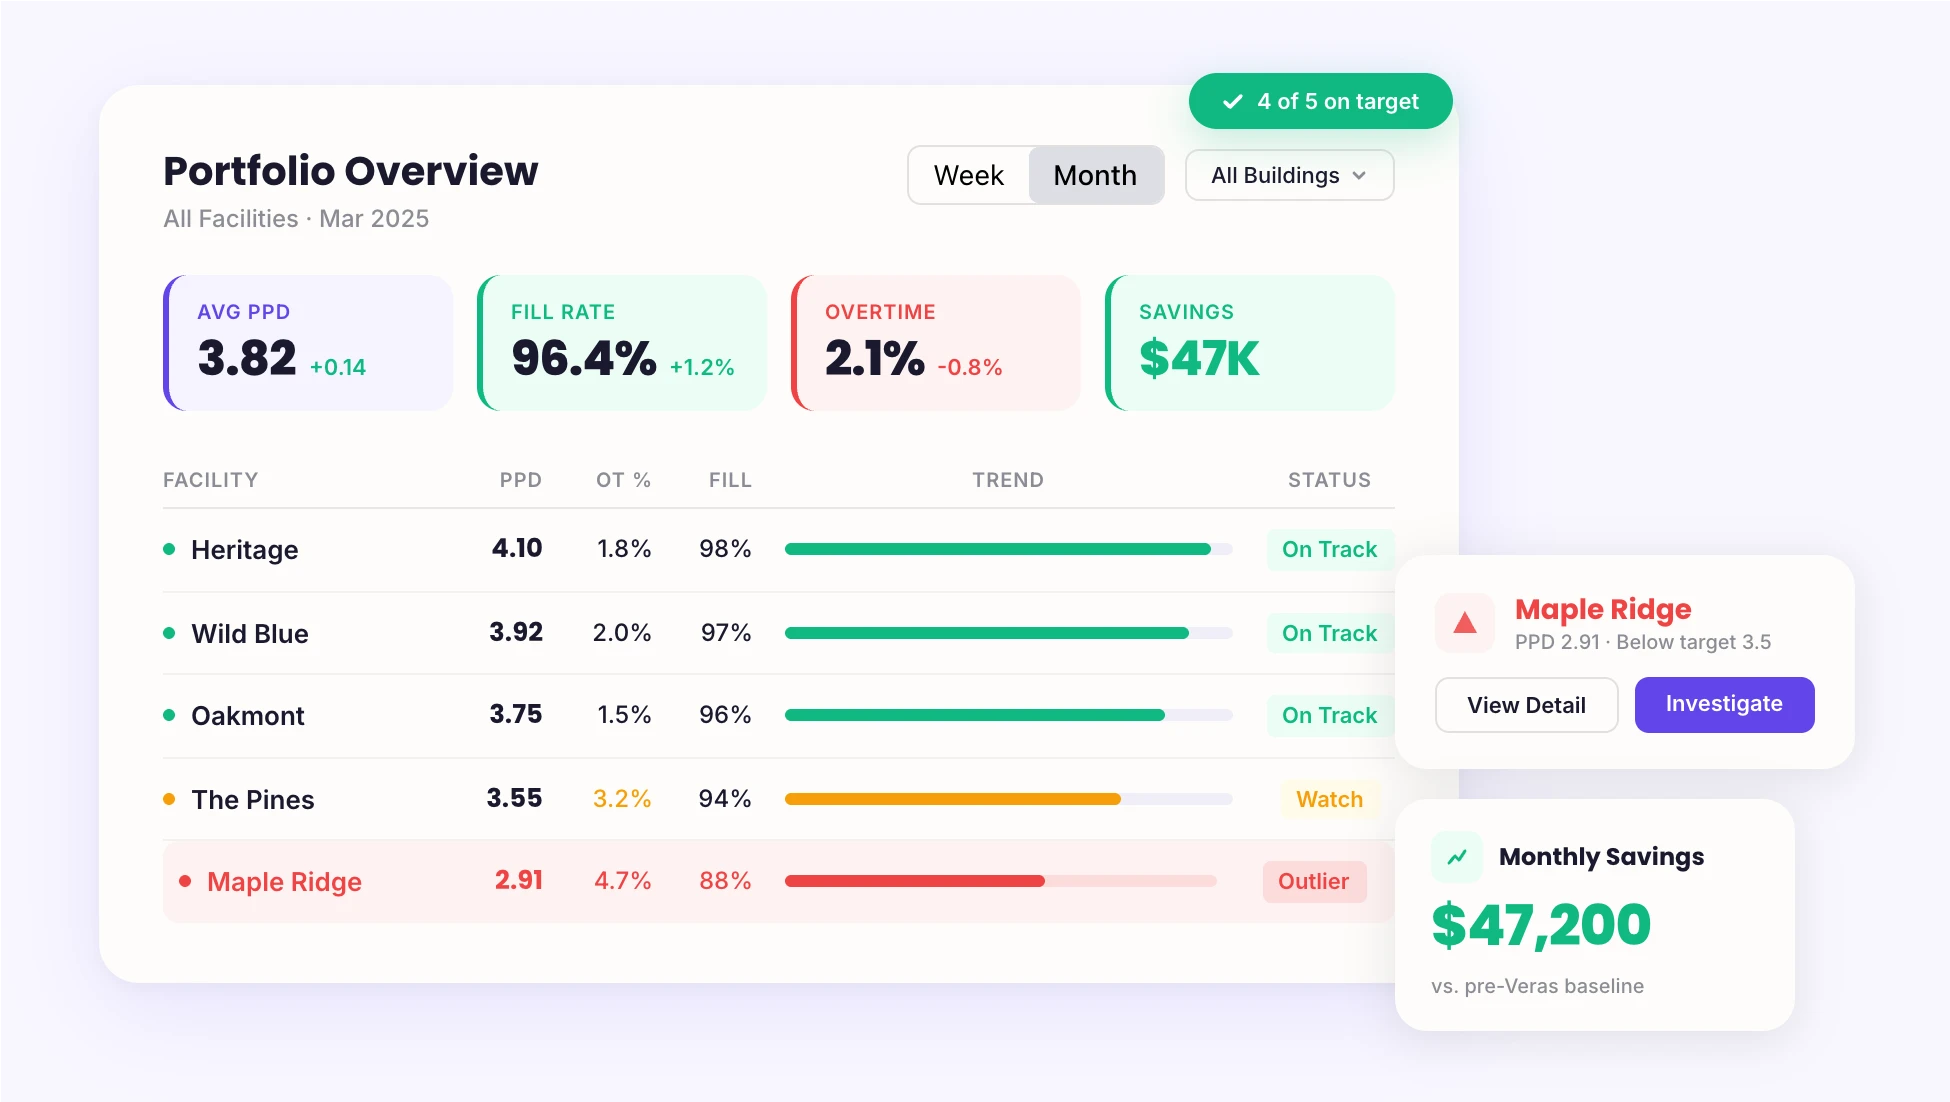
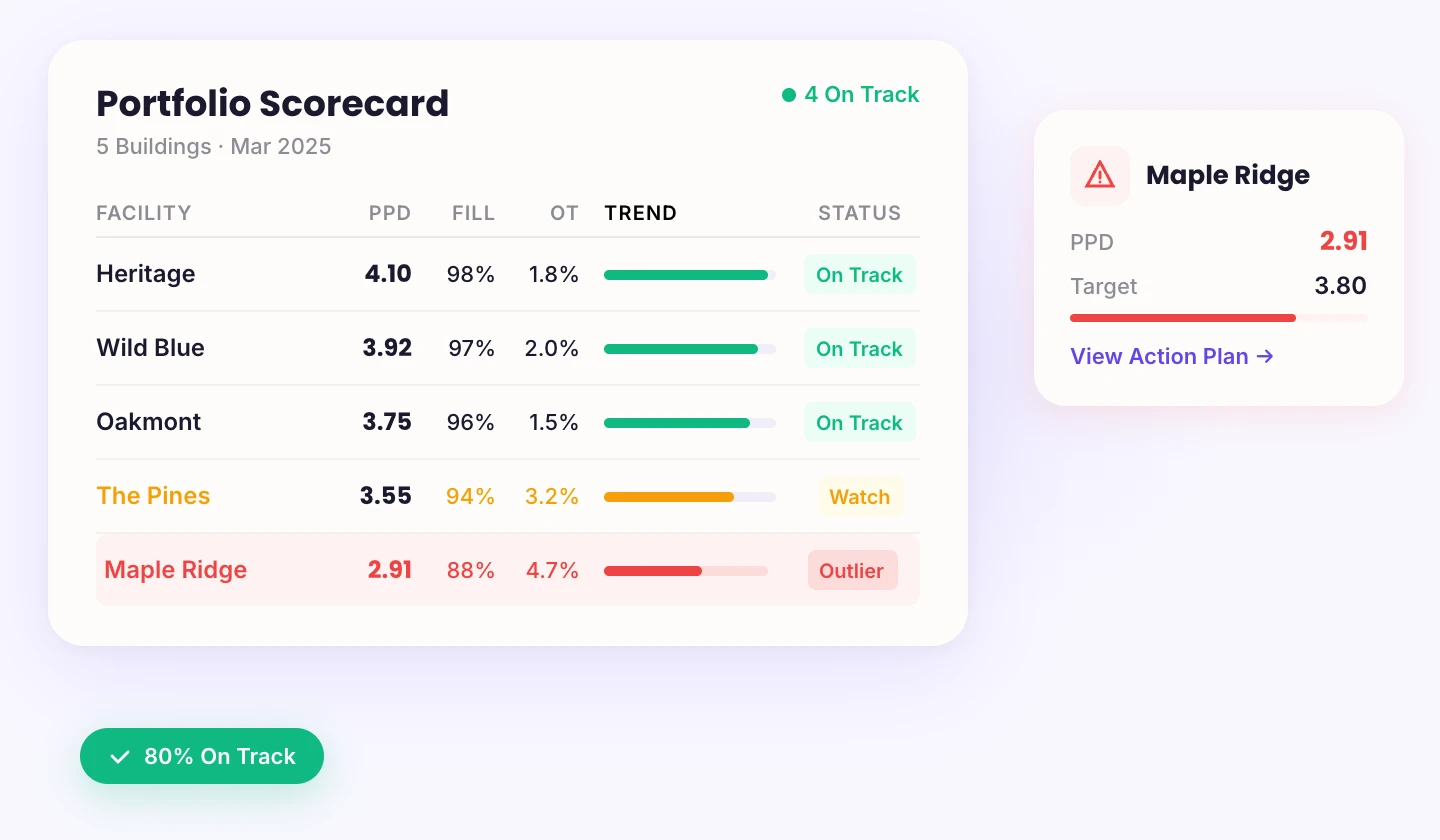
Every building. One screen.
Portfolio-level visibility without the spreadsheet assembly. Compare overtime, labor costs, staffing ratios, and fill rates across all facilities. Identify outliers. Spot trends before they become budget problems.
12+ metric columns including Overtime, Avg PPD, Agency Shifts, Extra Time, Tardies, Call Off %, and Missed Breaks.
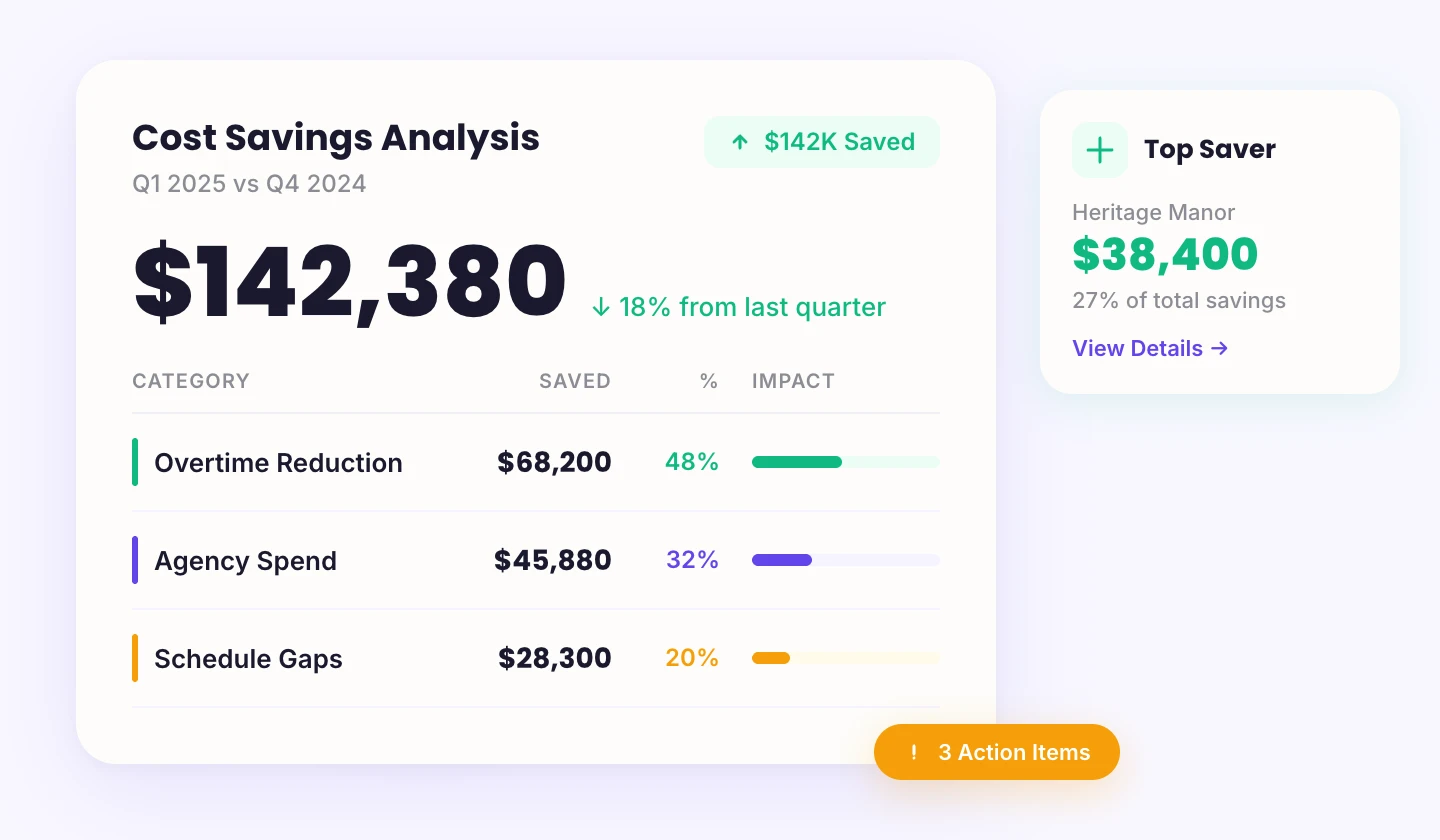
Know exactly what the platform is saving you
Per-facility savings breakdown across overtime, missed breaks, extra time, and agency costs. Real dollar amounts, not abstract percentages.
See the ROI of better scheduling and time tracking in one view.
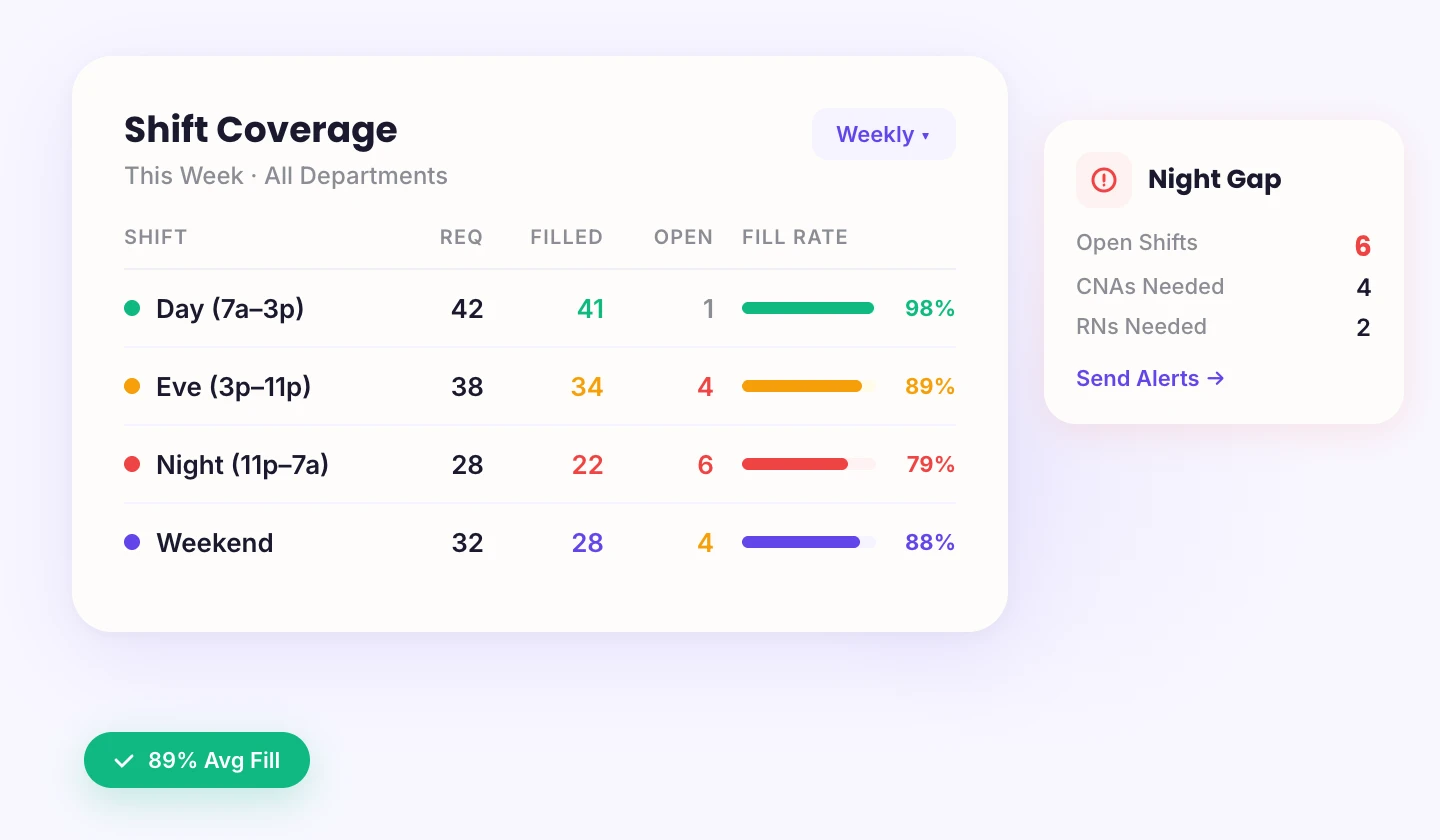
Are we covered today?
Scheduled staff, open shifts, and call-offs by position. The question every DON asks every morning, answered on screen — not in a spreadsheet someone updates on Thursdays.
Staffing gaps and coverage indicators update as the schedule changes.
See overtime before it hits payroll
Real-time overtime tracking against facility and position-level policies. Wage PPD by department. Budget vs. actual labor costs. The numbers update as schedules change and staff clock in.
Not at the end of the pay period. Right now.
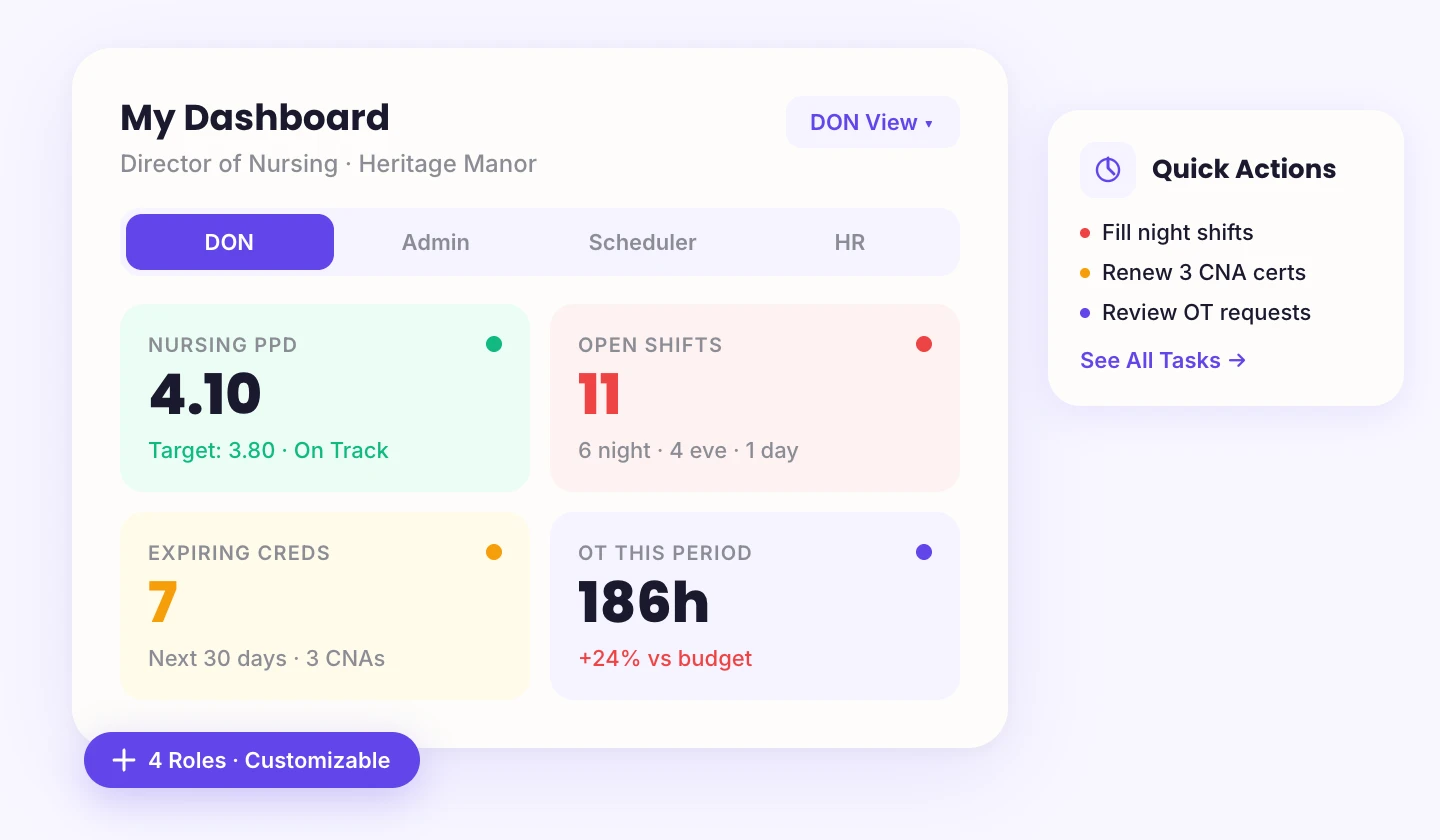
Executives see the portfolio. DONs see the floor.
Each role gets a dashboard built for their decisions. Executives see portfolio trends. Facility leaders see operations. Schedulers see shifts.
No digging through reports meant for someone else.
Reporting is the result, not a separate product
Veras reporting isn't a standalone analytics tool you configure separately. It's the visibility layer that sits on top of scheduling, time tracking, and payroll — pulling live data from the same system your team uses every day.
Scheduling → Reporting
PPD, fill rates, and labor cost projections update as the schedule changes. No waiting for payroll close.
Time & Attendance → Reporting
Actual hours, overtime, and attendance patterns feed reports in real time — not at the end of the pay period.
PBJ → Reporting
Staffing data flows directly into CMS-ready PBJ reports. No manual scrubbing.
Go live in weeks, not months. White-glove onboarding from a team that understands long-term care.
See what your operation looks like when the data is already there
30-minute walkthrough. Real-time dashboards, multi-facility visibility, and the numbers your team needs — from the same system they already use.